Twinup data infrastructure

Integrator: one validated stream from every source.

The common data layer that feeds our digital twin platform and every one of our solutions. It takes the data of your organisation's devices, field systems and files from the source, converts it to a common format, validates it and delivers it to every application that needs it.

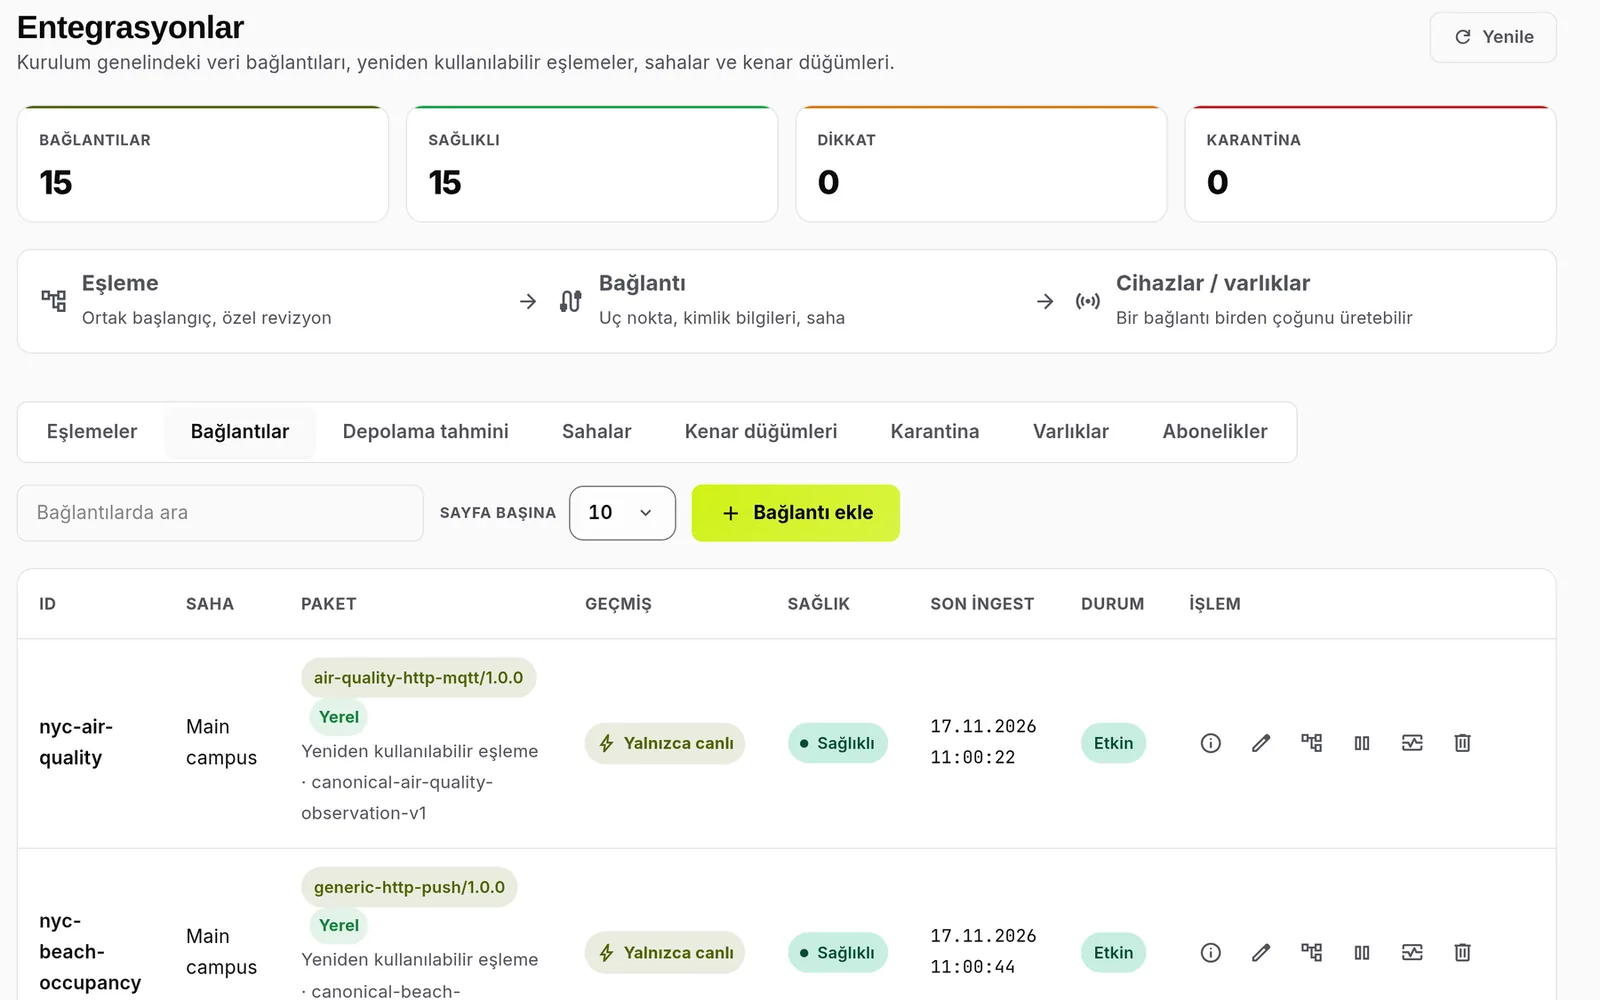
Integrator's Integrations screen: counters for connections, healthy, attention and quarantine, with the connection table below
Why it matters

An organisation's data never comes from one place. The air quality station publishes over MQTT, the vehicle tracking company offers a web service, the inventory lives in an Excel file, the zoning layer arrives as KML. Each has its own field names, units, date format and way of failing.

Integrator closes that gap in one place. The digital twin platform and the solutions running on it (map, dashboards, alerts, reports) never need to know the source's format; they all use the same validated data in the common format.

What gets easier
Without IntegratorWith Integrator
A new data sourceSeparate software is written for every source.A connection is added from the management screen. If there is no ready package, the package and the mapping are defined as data.
Different field names and unitsThe conversion is buried in code; changing it needs a new release.Fields are linked with clicks on the mapping screen; a formula handles unit conversion and the result is visible before saving.
Faulty or missing recordsBad data leaks into dashboards and reports.A record that breaks the contract is quarantined and never reaches the modules.
A source goes quietNobody notices for a while that the data stopped.Each connection's health and last data time are visible; a connection with no new data is flagged.
Storage costYou find out afterwards how much space it takes.A storage estimate is drawn from each connection's real traffic; history retention is chosen per mapping.
Personal dataIt is handled separately in every integration.Delete, mask and pseudonymise rules are set in the mapping.
How it works

Every record takes the same path

  1. 01

    Collect

    The source sends, Integrator polls at an interval, or a file is uploaded.

  2. 02

    Raw record

    On connections that keep history, incoming data is archived unchanged.

  3. 03

    Decode

    Formats such as CSV, XML and KML are unpacked into JSON, record by record.

  4. 04

    Map

    The vendor's fields are linked to the common fields and units are converted.

  5. 05

    Validate

    The result is checked against the target service's contract.

  6. 06

    Quarantine

    A record that fails the check waits here and is not published.

  7. 07

    Publish

    A record that passes is delivered to the module's service.

What data it accepts

Every way in is a connector package

A package defines how the data is taken in and which settings the connection form asks for. Ready to use:

HTTP pushHTTP pollingMQTTFile uploadSFTP folderModbus TCPVendor-specific services
File and text formats
JSON arrayNDJSONCSVXLSXXMLGeoJSONKML / KMZZIP / GZIPYAMLHTML tablesyslogkey=valuelogfmtFixed-width textGrokPrometheus text format
Ready source folders
AFAD earthquake dataOpen-MeteoVisual CrossingADS-B flight dataOpenStreetMapIstanbul (İBB) open dataVehicle trackingLightingEnergy monitoringWaste management

Collect data right next to the source. An edge node is a small piece of software installed on the network where the devices are. It polls REST services, subscribes to MQTT, watches the SFTP folder, reads Modbus and sends what it collects to Integrator. Collection capacity grows by installing a node on each network segment.

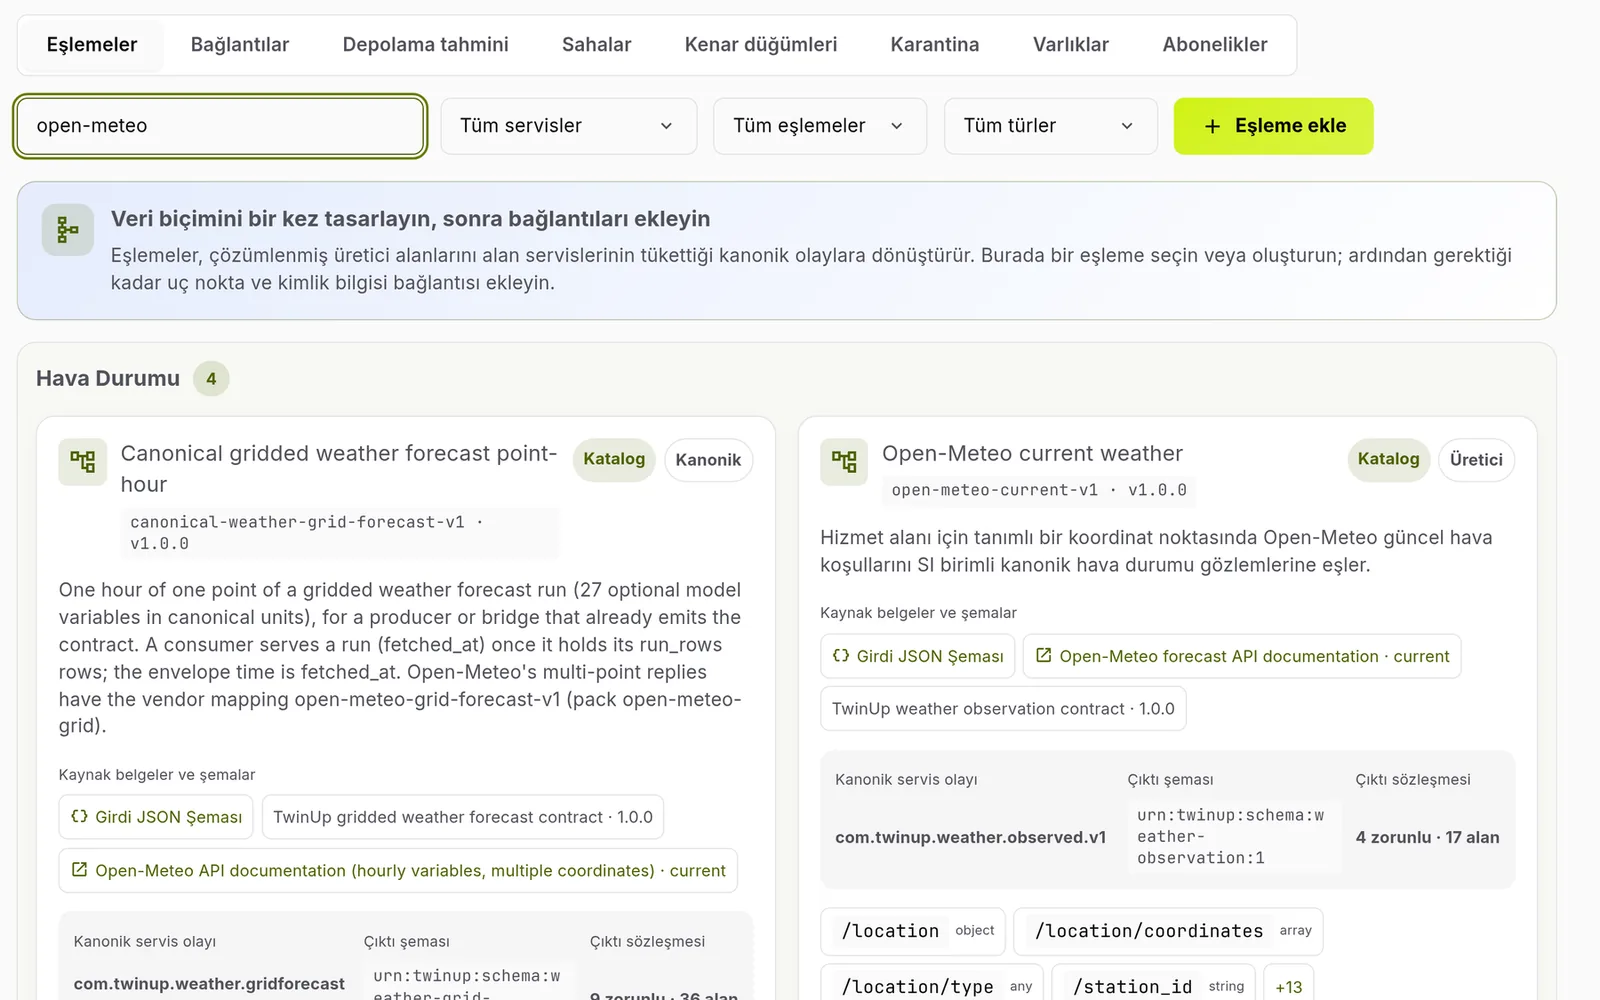
The mapping library: weather mapping cards with their target contract, fields and compatible packages
Mapping library
Mapping

Convert with clicks, not code

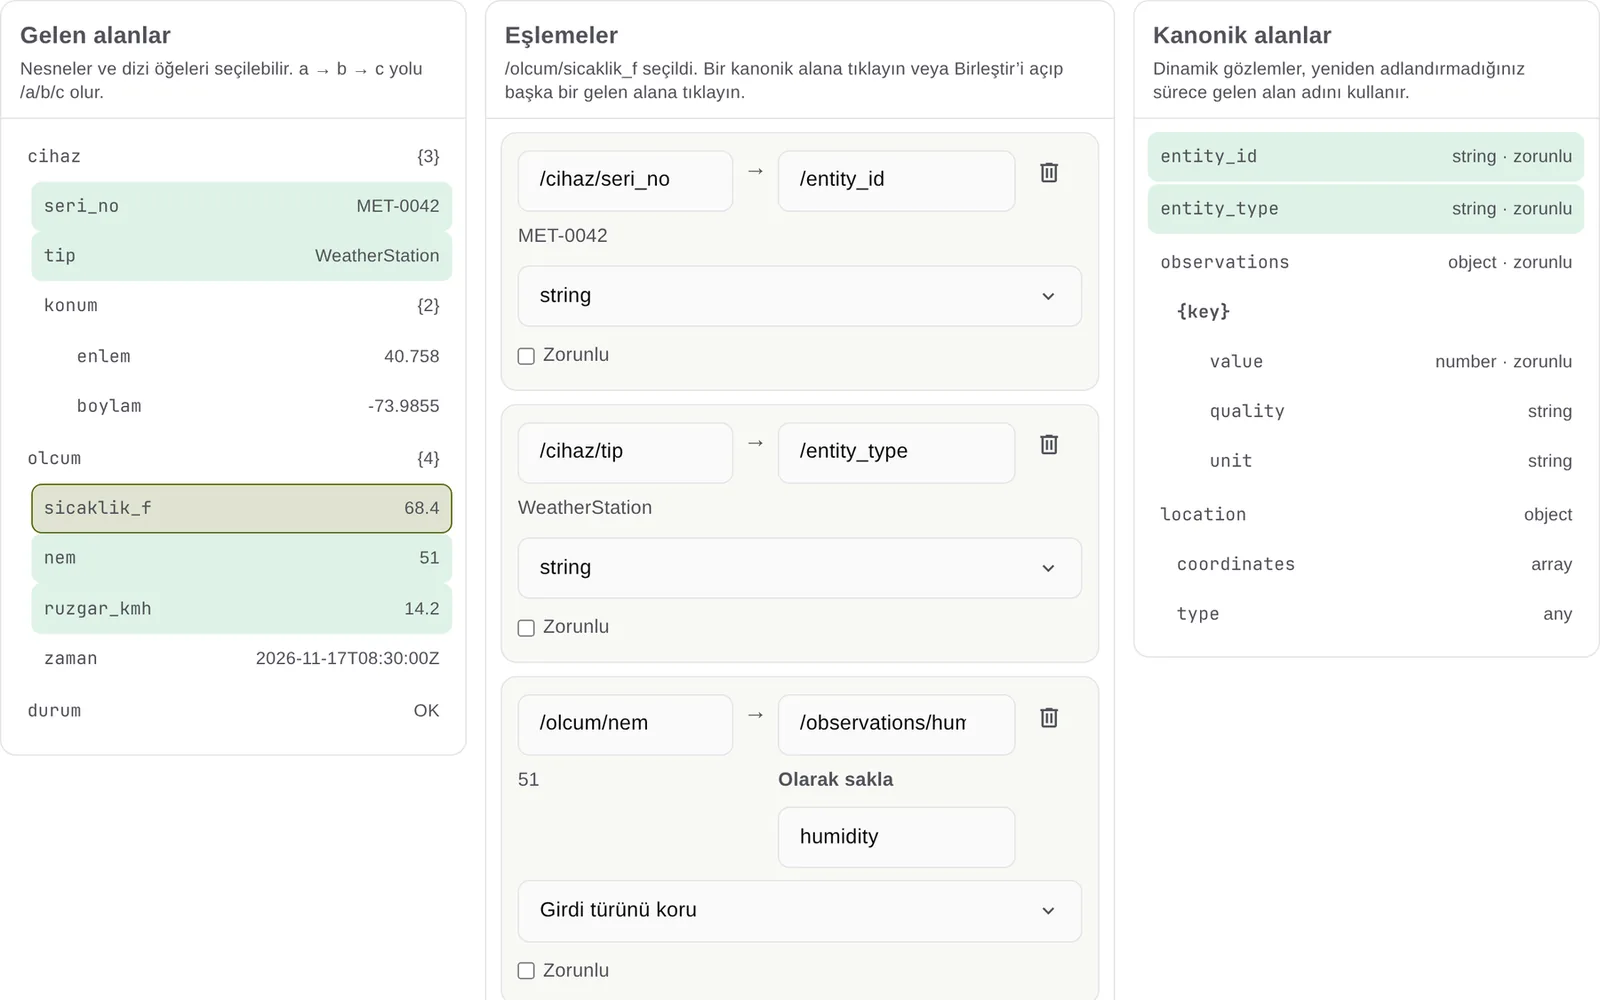
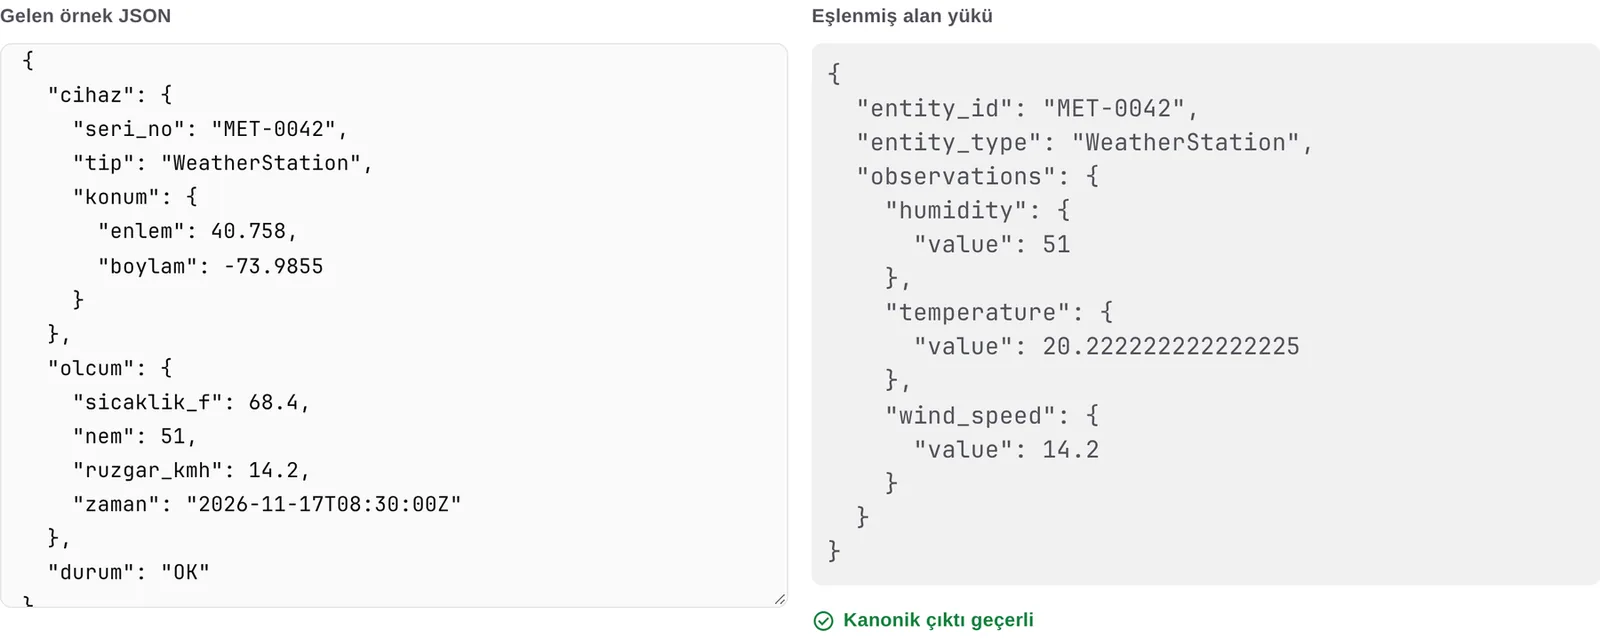
Example: a weather station sends temperature in Fahrenheit, under its own field names. The mapping that turns it into the common IoT format takes three steps.

  1. 01

    Define the mapping

    Start blank or from the catalogue. Choose the target contract, the input type and the retention setting.

  2. 02

    Link the fields

    Paste a sample record. Click an incoming field, then a common field, and the rule is made; linked fields turn green, so a missing required field shows at once.

  3. 03

    See the result, save

    Preview runs the mapping on the sample and checks it against the contract, publishing nothing. A mapping that breaks the contract cannot be saved.

The mapping editor: incoming fields on the left, rules in the middle, common fields on the right
Incoming fields · rules · common fields
The vendor's JSON on the left, the mapped common record on the right with the valid check
The vendor's record and the common record the platform sees
Connections

Easy to add, clear to watch

A connection always starts from a mapping. Name it and pick the site, choose a package that fits the mapping and, if needed, the edge node that will poll the data; the form builds itself from the package definition. Token and password fields are stored encrypted and never shown again.

You decide how much history to keep: Live only · Keep history

Health badges
  • HealthyData arrives at the expected interval.
  • WaitingThe connection is on; no data yet.
  • No new dataThe last data is older than expected.
  • DegradedData arrives but part of it ends up in quarantine.
  • ErrorThe source could not be read: credentials refused, the service returned an error or an empty reply.
  • Paused / DraftThe connection is not running.
After the data arrives
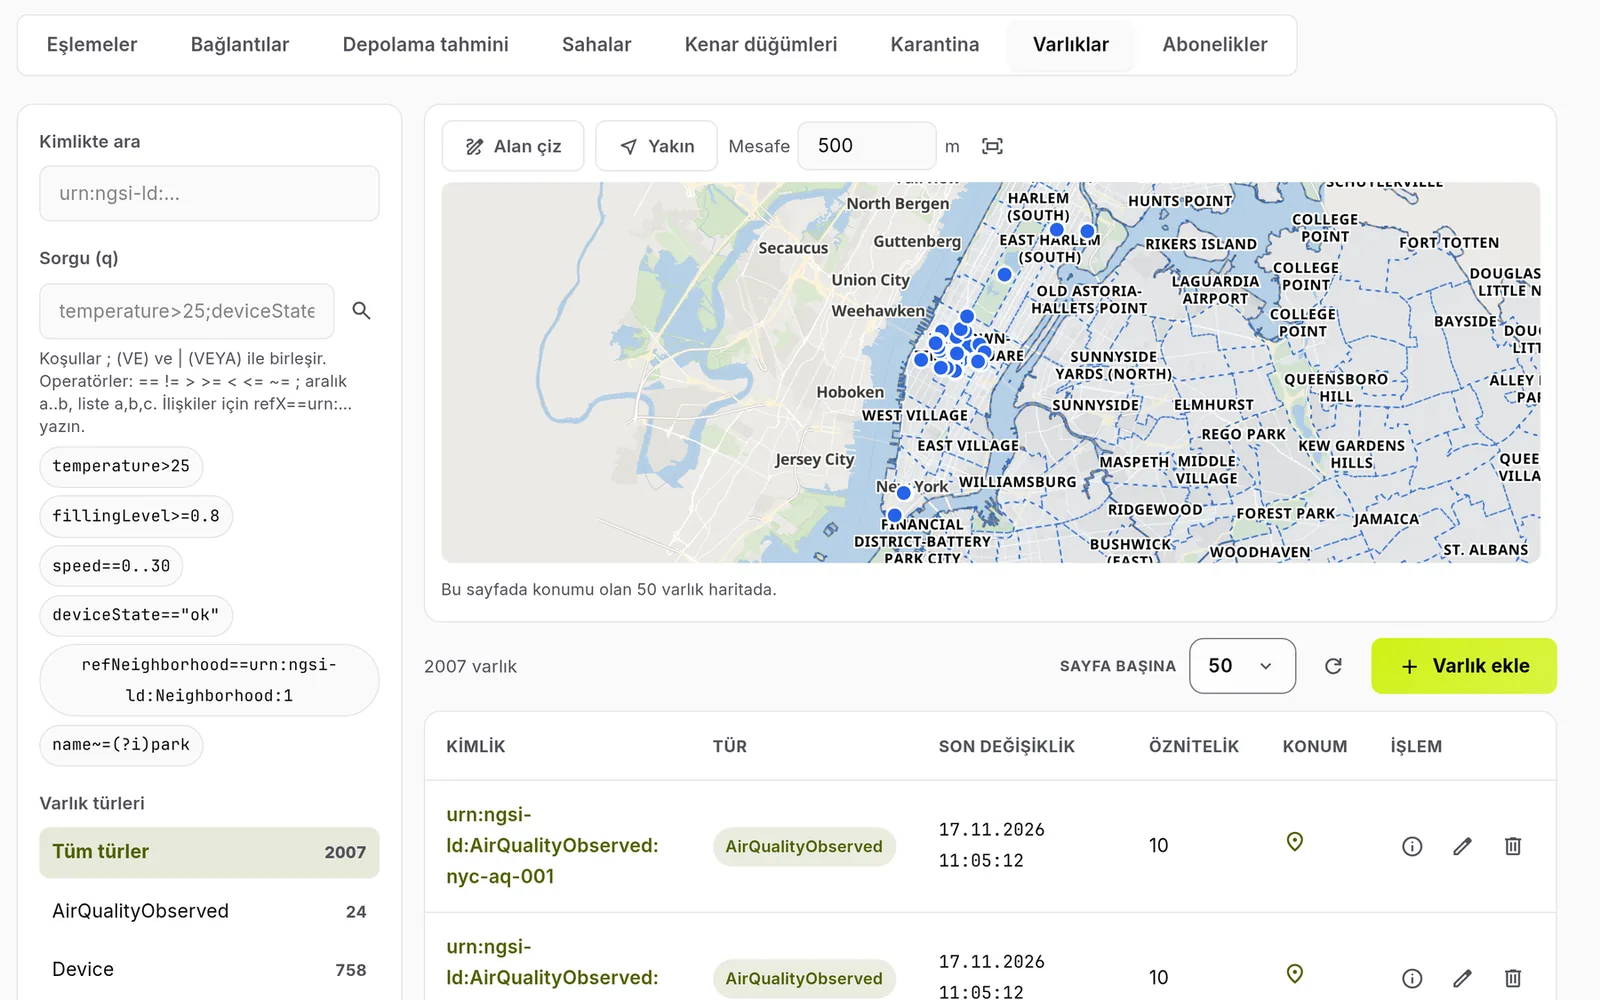
The Entities screen: sample queries, entities on a map and the entity list
Entities · demo data

Entities and subscriptions

The Context Broker serves the data in NGSI-LD, the shared standard of smart city applications. Entities are queried by type, ID, condition (temperature>25) and an area drawn on the map. A subscription notifies an HTTP(S) address or an MQTT topic when something changes (for example when a bin passes 80% full).

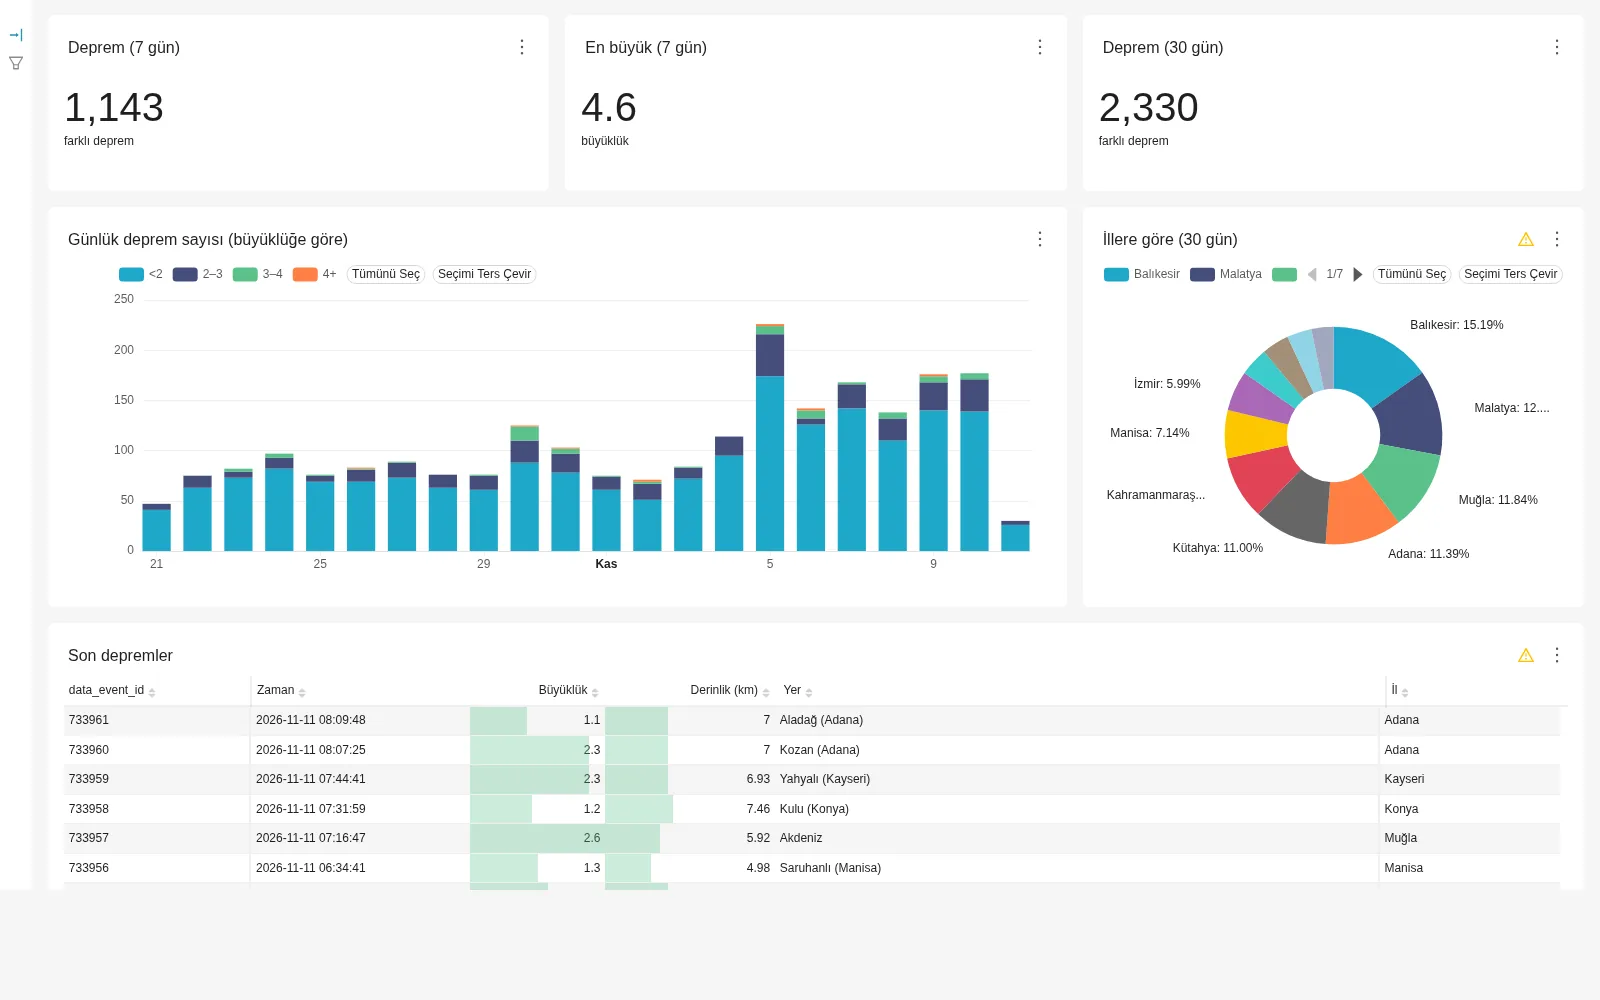
A sample dashboard built on AFAD open earthquake data: period totals, daily distribution and share by province
Sample dashboard on AFAD earthquake data · test installation

Big data and analytics

Events from mappings that keep history are written to a column-based analytics database (ClickHouse). Each data type arrives as a ready, typed table; in the Big Data & Analytics module (Apache Superset) you build your own dashboards by drag and drop or with SQL.

Security and access

Your data stays with you

The installation is yours

It is installed separately for each organisation; data is never kept in an environment shared with another. There is no component that sends data to a vendor, no remote shell and no tunnel.

Encrypted credentials

Passwords and tokens of source systems are encrypted with AES-256 and never appear on screen, in service replies or in logs.

A token per connection

One source's token cannot write data to another connection.

Personal data protected in the mapping

Delete, mask and pseudonymise rules; the pseudonym key stays in the installation, never inside the mapping.

Audit log

Changes to mappings, connections, sites and edge nodes, reprocessing and access to raw records are logged with the user who did it.

Role-based access

Viewing, managing, code-based conversion and reprocessing are separate permissions, all granted from the platform's role management.

Frequently asked questions
Do we need to write software to add a new data source?

Not if the source delivers data over one of the ready paths (HTTP, MQTT, file, SFTP): the mapping and the connection are set up on screen. A source with its own web service gets a connector package; a package is a configuration file and needs no new Integrator release.

Our data isn't in the common format. What do we do?

You don't have to change the source. Paste a sample record into the mapping editor and link the fields to the target fields. Unit or format differences are converted with a formula.

What happens to a faulty record?

It is quarantined and reaches no module. The connection shows “Degraded” with the reason code. Other records and other connections are not affected.

Is data lost if the source or the network goes down?

Integrator can't create data the source produced during the outage; if the source offers history it can be fetched again. When the edge node can't reach Integrator it retries and keeps running on its last good plan. The outage shows on screen as “No new data” or “Error”.

Does data leave the organisation?

Integrator delivers data only to the services in your installation; it sends nothing to a vendor or another organisation. Subscriptions you define in the Context Broker notify the addresses you choose.

How do our own applications use this data?

Through the platform's REST services and live MQTT topics, or through the Context Broker's NGSI-LD interface and subscriptions. Applications never connect to Integrator's internals directly.

Digital twin

The data Integrator brings in becomes a living city in the digital twin.

Our digital twin platform and our smart city, mobility, disaster and energy solutions all work from the same validated data.

Explore the digital twin platform →
  • HTTP
  • MQTT
  • SFTP
  • Modbus TCP
  • CSV · XLSX
  • GeoJSON · KML
  • NGSI-LD

Get Started

Bring this to your operation.

Tell us about your infrastructure and our engineers will map this solution to your needs.